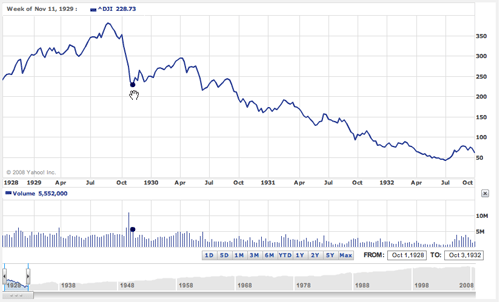
At this point, it’s worth taking a look at what happened in 1929. If you’re not yet familiar with this chart, let’s just say that you probably will become familiar with it over the next few years. This chart is from Yahoo. Click the image to go to Yahoo’s Finance site and play with it for yourself. (You may need to adjust the chart yourself back to the date range shown here.) I’ve put the cursor over the week of November 11, which is right before a powerful rally. But it’s a fools rally. For the next two years the Dow continued to decline another 85%! In fact, here are the stats:
- a 40% decline from a high of 380.33 starting August 26, 1929 and ending the week of November 11, 1929
- a powerful 28.5% rally that lasted until April 1930
- a fall of 86% over the following 2 years until a low of 41.63 was reached on July 5, 1932
A total fall in the value of the Dow of 90%. If this were to happen today the Dow would end up at 1409.30. No the decimal is NOT in the wrong place.
If you are watching gold and the dow/gold zoom, then you have probably already considered that this could happen. Let me make this clear… THIS COULD HAPPEN. That doesn’t mean it will. What it means is that it COULD. It’s very easy to become so used to certain situations, hey, sometimes they’re all we’ve known in our entire lives, and we come to believe that things will always be as they are. The best way to save yourself in this market environment is to realize what could happen and protect yourself accordingly. Don’t fool yourself into thinking it can’t happen. That goes for the political environment, too. If you’re new to the idea that gangs of criminals run the governments of the world, I suggest you read a little history and recognize that about all that’s changed is the sophistication of the criminal.
Educate yourself while you can still do it.
Be careful out there.


0 Comments